Figure 3-8 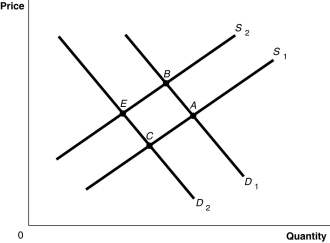
-Refer to Figure 3-8.The graph in this figure illustrates an initial competitive equilibrium in the market for apples at the intersection of D2 and S2 (point E) Which of the following changes would cause the equilibrium to change to point A?
Definitions:
Pricing Strategies
Comprehensive plans developed to find the optimal price point to maximize sales and profits while considering costs, competition, and customer demand.
Capital
In economics, capital refers to financial assets or the financial value of assets, such as funds held in deposit accounts, as well as the physical factors of production and facilities.
Risk-Averse
The preference to avoid taking risks, favoring safer or more predictable outcomes over potentially higher but riskier rewards.
Exporting
Exporting is the process of selling goods or services produced in one country to buyers in other countries.
Q8: Refer to Table 2-8.What is Ireland's opportunity
Q15: The production possibility frontier model shows that<br>A)
Q21: If the demand for a product increases
Q33: Income elasticity measures<br>A) how a good's quantity
Q53: The simple trade model demonstrates that countries
Q57: If opportunity costs are constant,the production possibility
Q104: Assume that when the price of rockmelons
Q134: If the cross-price elasticity of demand between
Q158: What is equity,and how does it differ
Q192: With the increased usage of mobile services,what