Multiple Choice
Table 6-1
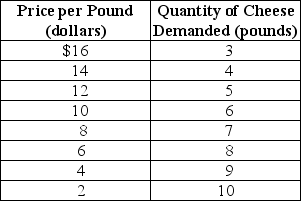
-Refer to Table 6-1.Over what range of prices is the demand elastic?
Definitions:
Related Questions
Q3: What is an externality?
Q6: The graph below represents the market for
Q13: Refer to Figure 4-4.The figure above represents
Q18: Refer to Figure 30-2.Which of the following
Q29: By the year 2019,health care's share of
Q60: If a doctor knows that an insurance
Q64: Refer to Figure 9-3.What is the area
Q112: The graph below represents the market for
Q113: With the increased usage of cell phone
Q135: The 2005 European Union Emission Trading Scheme