Figure 13-3 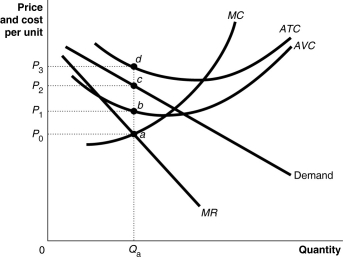
Figure 13-3 shows short-run cost and demand curves for a monopolistically competitive firm in the market for designer watches.
-Refer to Figure 13-3.What is the area that represents the total variable cost of production?
Definitions:
Expected Results
Anticipated outcomes or predictions made about future events or performances, often based on statistical analysis or forecasting methods.
Developing Products
The process of creating new products or significantly improving existing ones, which involves research, design, and development stages.
Diagonals
In geometry, straight lines connecting non-adjacent corners of a polygon or polyhedron. In finance, an options strategy combining different expiration dates and strike prices.
Verticals
Business units often structured as separate businesses within a parent company that develop products sold directly to consumers.
Q17: In the long run,if price is less
Q28: To maximize profit,a monopolist will produce and
Q47: What is a monopoly? Can a firm
Q63: Why do most firms in monopolistic competition
Q73: The "Discount Department Stores" industry is highly
Q96: What is allocative efficiency?<br>A) It refers to
Q103: Max Shreck,an accountant,quit his $80,000-a-year job and
Q105: In long-run perfectly competitive equilibrium,which of the
Q128: A firm using a two-part tariff can
Q142: Consider a downward-sloping demand curve.When the price