Figure 13-5 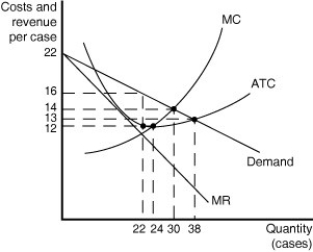
Figure 13-5 shows cost and demand curves for a monopolistically competitive producer of iced-tea.
-Refer to Figure 13-5.to answer the following questions.
a.What is the profit-maximizing output level?
b.What is the profit-maximizing price?
c.At the profit-maximizing output level,how much profit will be realized?
d.Does this graph most likely represent the long run or the short run? Why?
Definitions:
Plant Size
Refers to the scale of operations or production capacity of a manufacturing facility or factory.
Long Run
A period of time in economics during which all factors of production and costs are variable, allowing companies to adjust all inputs.
Least-cost Production
A production method where the combination of resources used minimizes costs for a given output level, achieving productive efficiency.
Per Unit Costs
The average cost of production or delivery per individual unit, calculated by dividing total costs by the number of units produced or delivered.
Q7: Suppose we want to use game theory
Q16: Refer to Figure 15-9.Erickson Power is a
Q22: With perfect price discrimination there is<br>A) no
Q29: One reason why,in the short run,the marginal
Q29: Refer to Figure 15-2.Suppose the monopolist represented
Q66: Refer to Figure 11-7.The lines shown in
Q87: All of the following are characteristics of
Q92: Refer to Figure 14-4.How will Rainbow Writer
Q102: The long-run average cost curve shows<br>A) the
Q142: The standards used by the Department of