Multiple Choice
Figure 3-8 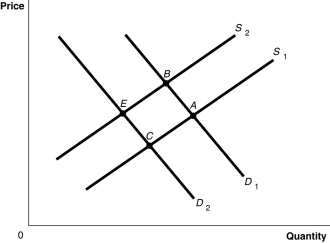
-Refer to Figure 3-8.The graph in this figure illustrates an initial competitive equilibrium in the market for apples at the intersection of D2 and S2 (point E) ) Which of the following changes would cause the equilibrium to change to point A?
Definitions:
Related Questions
Q28: Refer to Table 4-4.If a minimum wage
Q92: Refer to Figure 4-1.If the market price
Q120: Assume that the demand curve for MP3
Q124: Congressman Flack votes for a program that
Q144: Refer to Table 2-5.The Shellfish Shack produces
Q151: Price ceilings are illegal in the United
Q160: Tesla Motors manufacturers its cars at a
Q176: Refer to Figure 3-1.If the product represented
Q212: What is the difference between an "increase
Q254: Refer to Figure 2-7.Assume that in 2014,Mercedes