Figure 13-10
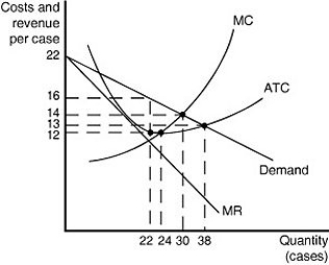
Figure 13-10 shows cost and demand curves for a monopolistically competitive producer of iced tea.
-Refer to Figure 13-10.to answer the following questions.
a.What is the profit-maximizing output level?
b.What is the profit-maximizing price?
c.At the profit-maximizing output level, how much profit will be realized?
d.Does this graph most likely represent the long run or the short run? Why?
Definitions:
Independence Test
A statistical procedure used to determine whether two or more variables are independent of each other within a population.
Frequencies of Repairs
Frequencies of Repairs refer to the number of times repairs have been made within a specific period, indicating the maintenance needs or reliability of an item.
Automobile Manufacturer
A company engaged in the designing, production, marketing, and selling of motor vehicles.
Sample
A subset of individuals or observations selected from a larger population, used to infer or make predictions about the population.
Q4: If buyers of a monopolistically competitive product
Q14: Which of the following statements is correct?<br>A)
Q63: A four-firm concentration ratio measures<br>A) the extent
Q73: Consider two single-malt whiskey distillers,Laphroaig and Knockando.If
Q101: Why are demand and marginal revenue represented
Q117: A dominant strategy is<br>A) an equilibrium where
Q147: By the 21st century few people purchased
Q163: What is the difference between "shutting down
Q189: If price = marginal cost at the
Q264: Assume that the LCD and plasma television