Figure 11-8
-Refer to Figure 11-8 above to answer the following questions.
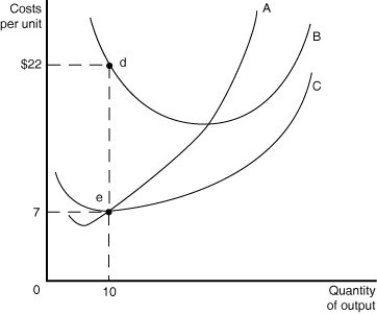
a.Identify the curves in the diagram.
A ________ B ________ C ________
b.What is the numerical value of fixed cost when the quantity of output =10?
c.What is the numerical value of variable cost when the quantity of output =10?
d.What is the numerical value of total cost when the quantity of output =10?
e.What is the numerical value of average fixed cost when the quantity of output =10?
f.What is the numerical value of average total cost when the quantity of output =10?
g.On the graph identify the area that represents the total variable cost of production when the quantity of output =10.
h.On the graph identify the area that represents the fixed cost of production when the quantity of output =10.
Definitions:
Xy Axis
The two perpendicular lines in a cartesian coordinate system that define the horizontal and vertical dimensions for plotting points in a plane.
Positive Correlation
A statistical relationship where two variables move in tandem; as one variable increases, the other does as well.
Bivariate
Involving or dependent on two variables, often used in statistical analyses to examine the relationship between two sets of data.
Continuous Variables
Variables that can take an infinite number of values within a given range.
Q38: Refer to Table 1-3.What is Santiago's marginal
Q102: Economists do not think it is possible
Q114: Which of the following statements is true?<br>A)
Q118: A firm could continue to operate for
Q179: Suppose the total cost of producing 40,000
Q197: The basic activity of a firm is<br>A)
Q205: The marginal product of labor is defined
Q231: Pookie's Pinball Palace restores old Pinball machines.Pookie
Q236: If Lisa spends her income on veggie
Q307: At the minimum efficient scale<br>A) all possible