Figure 11-14
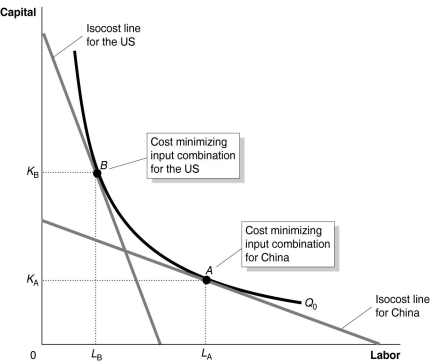
Figure 11-14 shows the optimal input combinations for the production of a given quantity of cotton in the United States and in China.
-Refer to Figure 11-14.Which of the following could explain why the United States and China use different input combinations to produce a given quantity of cotton and yet, each country produces that quantity at the lowest possible cost?
Definitions:
Blood Transfusion
The process of transferring blood or blood-based products from one person into the circulatory system of another.
Intravascular Volume
The total volume of blood within the vascular system of the body.
Oxygen-carrying Capacity
The maximum amount of oxygen that can be transported by hemoglobin within the blood.
Clotting Factors
Proteins in the blood that work together to form a blood clot, helping to stop bleeding.
Q53: Refer to Figure 10-7.Suppose the price of
Q72: Allocative efficiency is achieved when firms produce
Q147: If production displays economies of scale,the long-run
Q162: Identify the one statement that does not
Q220: Under J.C.Penney's everyday low pricing policy,the everyday
Q231: Pookie's Pinball Palace restores old Pinball machines.Pookie
Q246: If,as a perfectly competitive industry expands,it can
Q267: What is the endowment effect?<br>A) the phenomenon
Q298: When the marginal product of labor rises<br>A)
Q317: If production displays increasing marginal returns,then<br>A) total