Figure 3-3 shows shifts in the supply curve of a good. A change from Point A to Point C represents a(n) :Figure 3-3 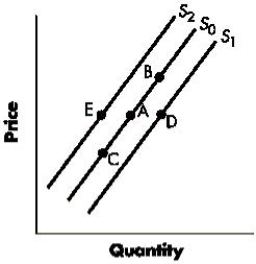
Definitions:
Shortage
A situation where the demand for a product or service exceeds its supply in a market.
Quantity Supplied
The amount of a good or service that producers are willing to sell at a given price over a specific period.
Inventories
Quantities of goods or materials on hand or in the process of being produced for sale.
Supply Curve
A graphical representation showing the relationship between the price of a good and the quantity of the good that producers are willing to supply.
Q2: The welfare loss from monopoly is not
Q6: A monopolist can sell 20 units a
Q10: Two goods are complements if an increase
Q18: Productive efficiency requires production at a quantity
Q25: If the marginal revenue from the tenth
Q46: How short is the short-run production period?
Q68: Graph A below shows an elastic demand
Q72: Which of the following is an example
Q91: From the perspective of a firm, is
Q159: Landsdowne Corp.has decided to insure its buildings