Graph A below shows an elastic demand curve, and Graph B shows an inelastic demand curve. With reference to Graph A, at a price of $20, total revenue equals _____.Figure 4.1: 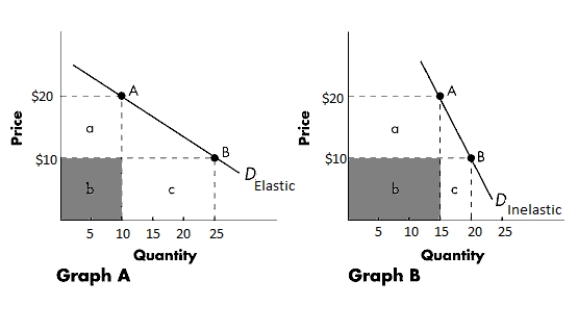
Definitions:
Units in Process
An inventory classification representing products partially completed in the manufacturing process, often evaluated at the end of an accounting period.
First-In, First-Out
An inventory valuation method where goods first acquired are the first to be sold.
Process Costing
A costing method used for homogeneous products, where costs are accumulated for a process or department and averaged over all units produced.
Total Cost
The aggregate expense incurred in producing a product or offering a service, including fixed and variable costs.
Q6: Which of the following is a characteristic
Q30: A decrease in the price of a
Q33: A monopolistic firm is a:<br>A)price taker that
Q41: The table below shows the price elasticity
Q54: The figure below shows the revenue and
Q68: A firm facing a horizontal demand curve:<br>A)can
Q70: The restaurants in San Francisco can probably
Q73: The circular flow model indicates that:<br>A)households demand
Q91: The following table shows Miles's demand for
Q103: What is financial control?