The figure below shows the long-run average cost curve for a firm. Based on the figure, the region x shows _____.Figure 6-5 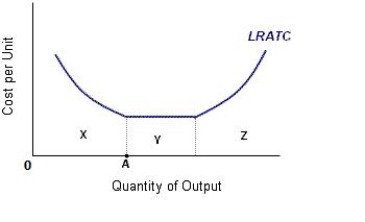
Definitions:
Option Contract
A contract which grants the holder the right to buy or sell an underlying asset at a predetermined price within a specified time frame.
Hedge Risk
A financial strategy used to limit or offset the probability of loss from fluctuations in the prices of currencies, commodities, or securities.
Speculate
The act of investing or trading in financial assets with high risk in anticipation of significant returns.
American Option
A type of options contract that allows holders to exercise the option at any time up to and including the expiration date.
Q2: Figure 7-4 shows the relationship among the
Q10: "If the price of wine increases, the
Q34: A natural monopolist will voluntarily choose to
Q43: If every individual earned the same total
Q44: Voters will gather information on voting alternatives:<br>A)because
Q67: Diseconomies of scale occur when firms cannot
Q75: The demand curve faced by a perfectly
Q87: According to the law of supply, other
Q93: When marginal cost is below average total
Q95: Consumer surplus is positive as long as