Multiple Choice
Refer to Figure 7-1. Graphs A and B together demonstrate the effect that a change in market demand has on the demand curve faced by an individual firm. In this case, the firm is:Figure 7-1 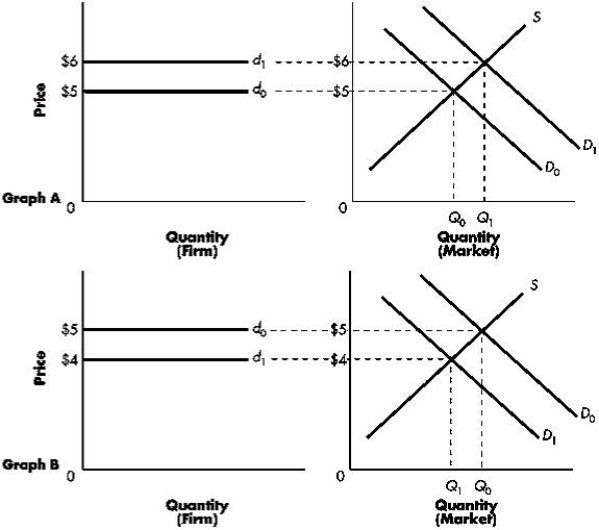
Definitions:
Related Questions
Q9: Brady, a farmer, sells wheat in a
Q10: A natural monopoly exists when one large
Q22: If the economy is operating at the
Q45: The following graphs show two firms operating
Q47: Which of the following would shift a
Q54: The following payoff matrix shows the possible
Q64: Perfectly competitive firms earn zero economic profits
Q80: Table 3-3 shows the market demand and
Q88: Where does the marginal cost curve intersect
Q91: Which of the following is likely to