The figure below shows the revenue and cost curves for a profit-maximizing monopolist. Based on the figure, consumer surplus is indicated by the area denoted by _____.FIGURE 8-7 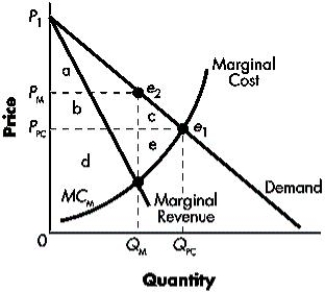
Definitions:
Long-run Cost Function
The relationship between output quantity and total cost when all inputs, particularly capital, can be varied to minimize cost.
Marginal Cost Curve
A graphical representation showing how the cost of producing one more unit changes with increased production.
Lease Price
The amount of money paid for the temporary use of a good, property, or piece of equipment.
Optimal Output
The level of production that maximizes a firm's profit or minimizes its cost under given conditions.
Q3: A set of money income thresholds, established
Q15: The figure below contains information on the
Q30: The category of unemployment that is a
Q43: Unlike perfectly competitive firms, monopolistically competitive firms
Q56: Explain how losses of existing firms are
Q62: Which of the following would not be
Q65: Which of the following is likely to
Q87: As output increases, variable costs decrease
Q97: If the decrease in the supply of
Q98: A supply shock is:<br>A)an expected event that