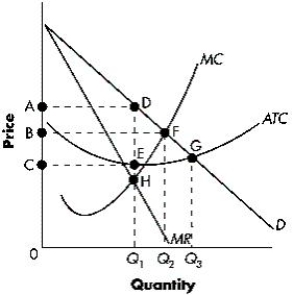
The figure below shows the revenue and cost curves of a profit-maximizing monopolist. Based on the figure, the total cost of producing the profit-maximizing level of output is indicated by the region ______.Figure 8-1: 
Definitions:
Appropriately Recognized
Pertains to the correct recording of financial transactions and elements in accordance with accounting standards and principles.
Critical Event
A significant occurrence or moment that has the potential to impact the course or outcome of a process or situation dramatically.
Generally Accepted Accounting Principles (GAAP)
A collection of commonly-followed accounting rules and standards for financial reporting within the United States.
Reported Profit
The profit figure announced by a company, typically found in its financial statements, after accounting for all expenses.
Q2: The table below shows the number of
Q6: Which of the following will lead to
Q9: The supply of a good is said
Q20: The failure of private incentives to provide
Q37: In order to maximize profits, a firm
Q63: If the gadget industry is a constant-cost
Q80: Constant returns to scale indicate that a
Q82: Which of the following best illustrates the
Q91: The figure below shows the revenue and
Q97: Define monopolistic competition.