Multiple Choice
The figure below shows the revenue and cost curves for a profit-maximizing monopolist. Based on the figure, welfare loss due to monopoly is indicated by the area _____.FIGURE 8-1 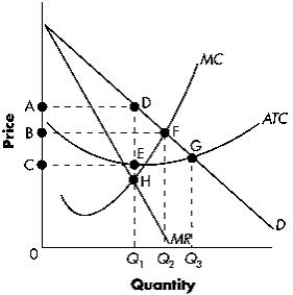
Definitions:
Related Questions
Q4: Figure 7-4 shows the relationship between the
Q5: Patents tend to slow down research and
Q19: With a negative income tax featuring an
Q25: In a recent fare war, America West
Q41: Consider a good that generates external benefits
Q60: Suppose a government imposes a binding price
Q67: Under what conditions can price discrimination be
Q80: Constant returns to scale indicate that a
Q84: In a monopolistically competitive industry, the competitive
Q92: For a perfectly competitive firm, average revenue