Multiple Choice
The figure below shows the total adult population in an economy and the number of civilians who are employed and unemployed. Based on the figure, the number of people considered to be out of the labor force is _____.Figure 11-1 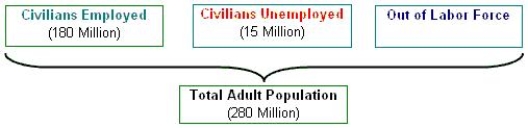
Definitions:
Related Questions
Q16: Increases in income from sources other than
Q24: Which of the following generates profits for
Q27: Would a tax on prescriptions drugs be
Q37: Other things equal, if the quantity of
Q49: When money demand increases, the Fed cannot
Q54: An increase in taxes in an economy,
Q58: In order to implement average cost pricing
Q61: In a circular flow model, the total
Q97: Figure 10-1 shows shifts in the market
Q100: A progressive tax system imposes higher marginal