The figure below shows the relationship between the real GDP and the price level of an economy. In the figure, _____ represents aggregate demand.Figure 13-1 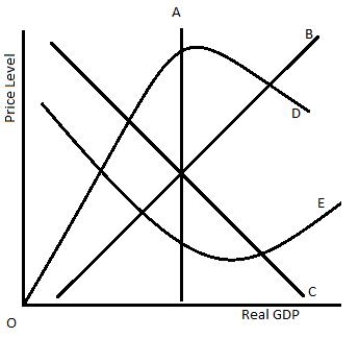
Definitions:
Manufacturing Cycle Efficiency
A ratio showing the value-added time as a percentage of the total lead time within a manufacturing process.
Delivery Cycle Time
The total time taken from receiving a customer order to delivering the finished product to the customer, encompassing all stages of the order processing and production process.
Turnover
The rate at which inventory or assets of a business are replaced or sales are made over a specific period.
Margin
Generally refers to the difference between the selling price of a good or service and its cost, expressed as a percentage of the selling price.
Q3: A reserve requirement of 12.5 percent implies
Q13: If the population of a nation expands
Q19: Which of the following is most likely
Q37: Expansionary and contractionary monetary policy can cause
Q58: Which of the following statements is true
Q60: According to the Taylor rule, if real
Q61: If the government wants to decrease the
Q64: Identify the correct statement.<br>A)Paper and metallic currency
Q78: The benefits received principle suggests that those
Q98: Which of the following accounted for the