Use the following to answer questions :
Figure: Nations A and B 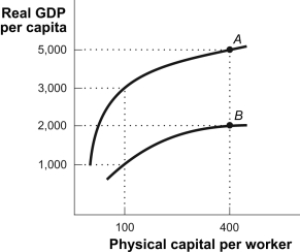
-(Figure: Nations A and
B) Look at the figure Nations A and B. Suppose that in 1960 each nation had $100 of physical capital for each worker and in 2010 each nation had $400 of physical capital per worker. Compute the growth of real GDP per capita for both nations.
Definitions:
Software Industry
The software industry encompasses businesses involved in the development, maintenance, and publication of software products, including systems, applications, and services.
Random Experiments
Experiments or procedures that have unpredictable outcomes, allowing for the study of probability and statistics.
Specific Interventions
Targeted actions or policies designed to address a specific issue or problem within a system or sector.
Social Overhead Capital
Public infrastructure investments made by the government or public sector, essential for economic development, such as roads, schools, and hospitals.
Q115: (Figure: Short- and Long-Run Equilibrium) Look at
Q121: The threat of future inflation:<br>A)makes people reluctant
Q131: Underemployed people are counted as employed even
Q182: Structural unemployment occurs when:<br>A)new workers enter the
Q191: (Figure: The Labor Market) Look at the
Q220: Which of the following is TRUE of
Q300: Which of the following does NOT qualify
Q366: Which of the following assets is the
Q370: (Figure: Short-Run Equilibrium) Look at the figure
Q386: National savings equals:<br>A)private savings plus consumption spending.<br>B)trade