Use the following to answer question: 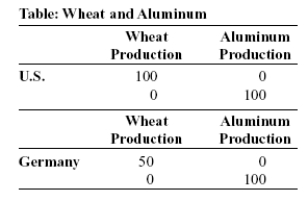
-(Table: Wheat and Aluminum) Look at the table Wheat and Aluminum. The table shows the maximum possible production of wheat and aluminum for both the United States and Germany. Are gains from trade possible between these nations? Explain.
Definitions:
Demand Curve
A graph showing the relationship between the price of a good and the quantity demanded, holding other factors constant.
Total Revenue
The total receipts or income a firm receives from the sale of its products or services, calculated as the unit price times the quantity sold.
Average Revenue
The amount of income that a company receives per unit of sale, calculated by dividing total revenue by the number of units sold.
Total Revenue
Total revenue represents the total income a firm receives from selling its goods or services, calculated as the quantity sold multiplied by the price per unit.
Q44: (Table: Wages and Hours Willing to Work)
Q57: Which of the following statements is FALSE?<br>A)Efficiency
Q65: (Figure: Production Possibility Frontier) Look at the
Q69: Professor Macro wants to use a numerical
Q98: If the opportunity cost of manufacturing automobiles
Q111: (Table: The Market for Chocolate-Covered Peanuts) Look
Q130: (Figure: Demand for Coconuts) Look at the
Q212: Economists who are asked to choose between
Q290: When a nation's economy grows:<br>A)its production possibility
Q291: Which of the following is sold in