Figure: Price Changes 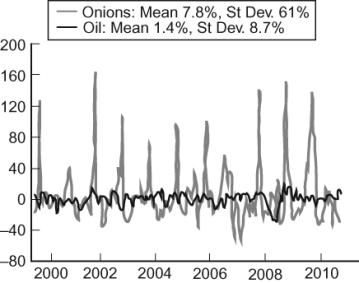 The figure (from Global Financial Data, EIA) illustrates in percentage terms how the price of onions (in gray) and crude oil (in black) fluctuate over time. The price of onions clearly fluctuates more than oil. In 1958, the United States Congress banned future markets on onions. How does this historical fact explain the difference in deviation between oil and onions?
Definitions:
Fair Value Accounting
An accounting approach where companies measure and report the values of their assets and liabilities on the basis of the actual or estimated fair market prices.
Book Value
The net value of a company's assets minus its liabilities, as recorded on its financial statements.
Market Valuations
The process of determining the present value of an asset or a company based on market prices, often used to evaluate the worth of stocks or other securities.
Quick Ratio
A financial metric that assesses a company's ability to pay its current liabilities without relying on the sale of inventory.
Q32: When a price ceiling is in effect:<br>A)
Q37: Figure: Price Ceiling in a Generic Market
Q86: Failing to understand the signaling role of
Q95: The United States is the world's largest
Q103: Most people, when asked, cannot name the
Q141: Which statement(s) is TRUE? Price floors set
Q143: In a free market, there are no
Q189: The Hollywood Stock Exchange allows users to
Q194: Speculators:<br>A) help stabilize prices over time.<br>B) profit
Q252: Price ceilings create five important effects:<br>A) shortages,