Multiple Choice
Use the following to answer questions:
Figure: Demand and Supply with Subsidy 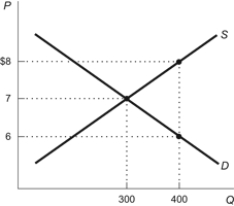
-(Figure: Supply and Demand with Subsidy) Refer to the figure. What is the deadweight loss caused by the subsidy?
Definitions:
Related Questions
Q20: To trade in oil futures, a trader
Q21: The long-run demand for oil _ the
Q55: A market's demand and supply curves are
Q65: A 4 percent increase in the price
Q68: If the price of cocoa rises by
Q98: How are oil prices and sugar prices
Q144: Nobel prize-winning economist Gary Becker suggested prohibited
Q177: (Figure: Demand, Supply Shifts) In the figure,
Q185: The price of good X increases from
Q251: Table: Supply Curve<br><img src="https://d2lvgg3v3hfg70.cloudfront.net/TB3377/.jpg" alt="Table: Supply Curve