Figure: Demand 1 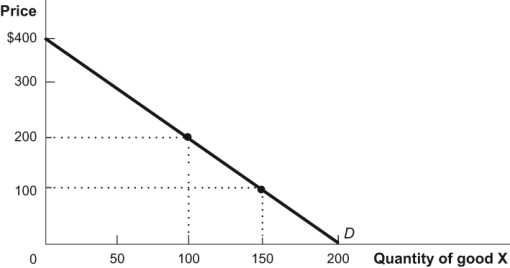 In the diagram, what is the elasticity of demand between a price of $100 and $200? Use the midpoint method of calculation to find your answer.
Definitions:
Q16: One of the determinants of the elasticity
Q32: Suppose that along a given demand curve,
Q61: With a tax on consumers, demand:<br>A) increases.<br>B)
Q79: Figure: Consumer Surplus <img src="https://d2lvgg3v3hfg70.cloudfront.net/TB3377/.jpg" alt="Figure: Consumer
Q102: In the elastic portion of a linear
Q103: Most people, when asked, cannot name the
Q129: As long as neither supply nor demand
Q143: If the elasticity of supply is 3
Q160: Figure: Demand-Driven Price Change <img src="https://d2lvgg3v3hfg70.cloudfront.net/TB3377/.jpg" alt="Figure:
Q178: The information problem for a central planner