Use the following to answer questions:
Figure: Shifts in Demand and Supply IV 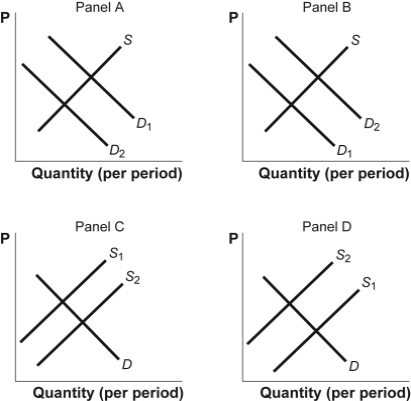
-(Figure: Shifts in Demand and Supply IV) Use Figure: Shifts in Demand and Supply IV.The figure shows how supply and demand might shift in response to specific events.Suppose the price of lumber falls dramatically.Which panel BEST describes how this will affect the market for new houses?
Definitions:
Supply Schedule
is a table or graph showing the quantity of a good that suppliers are willing to sell at different prices over a specific period.
Price Ranges
The spectrum of prices at which a particular good or service is sold in the market.
Equilibrium
A state where supply and demand are balanced, and in the absence of external influences, the values of economic variables will not change.
Total Revenue
The total receipts from sales of goods or services before any expenses are deducted.
Q6: If there is an excess supply of
Q94: What is the difference between a shortage
Q96: (Figure: The Market for Computers)Use Figure: The
Q99: (Table: International Transactions)Refer to Table: International Transactions.The
Q145: (Scenario: The Production of Wheat and Toys)Use
Q184: Rapidly increasing child daycare costs have been
Q188: The market for corn in Ontario is
Q216: A tariff is MOST likely to _
Q235: When a country joins the World Trade
Q238: The effect of international trade on Canadian