Use the following to answer questions: 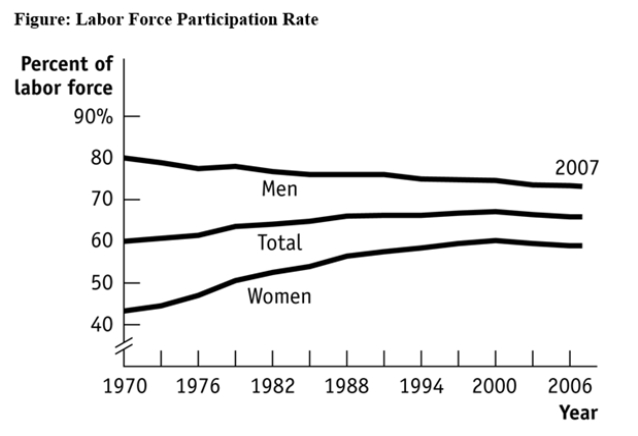
-(Figure: Labour Force Participation Rate) Use Figure: Labour Force Participation Rate.Using the figure,the labour force participation rate for women was _____ during 1970-1985 and _____ during 1998-2006.
Definitions:
Q5: (Table: Price,Quantity Demanded,and Quantity Supplied)Use Table: Price,Quantity
Q41: If Canada exports $100 billion of goods
Q56: (Table: Fish and Coconut Production Possibilities)Use Table:
Q75: Figure: Demand and Supply of Gasoline)Use Figure:
Q77: (Table: Market for Apartments)Use Table: Market for
Q78: (Figure: Change in Demand for Canadian Dollars)Refer
Q78: Quantity controls set below the equilibrium quantity
Q146: It is almost certain that the equilibrium
Q151: If New York City had no medallion
Q335: (Figure: Change in Demand for Canadian Dollars)Refer