Use the following to answer question: 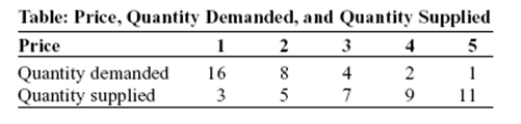
-(Table: Price,Quantity Demanded,and Quantity Supplied) Use Table: Price,Quantity Demanded,and Quantity Supplied.The slope of the line representing the relationship between price on the vertical axis and quantity demanded on the horizontal axis is:
Definitions:
Q29: (Scenario: Countries A and B)Use Scenario: Countries
Q33: Suppose there is an excess supply of
Q44: Price controls are always set below the
Q94: When price controls take the form of
Q104: (Table: The Demand for Chocolate-Covered Peanuts)Use Table:
Q113: (Figure: Wine and Wheat)Use Figure: Wine and
Q141: An economy is said to have a
Q188: (Table: Production Possibilities Schedule I)Use Table: Production
Q196: (Figure: The Loanable Funds Model in the
Q252: If the demand for pounds sterling in