Use the following to answer questions:
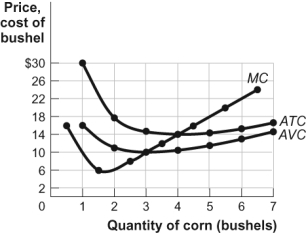
Figure: Cost Curves for Corn Producers 
-(Figure: Cost Curves for Corn Producers) Look at the figure Cost Curves for Corn Producers. The market for corn is perfectly competitive. If the price of a bushel of corn is $10, then in the short run the farmer will produce _____ bushels of corn and take an economic loss equal to _____.
Definitions:
Long Run
A period in economics during which all factors of production and costs are variable, allowing for full adjustment to change.
Average Total Cost Curve
A graphical representation showing how average cost changes with changes in output.
Zero Economic Profits
A situation in perfect competition where firms earn just enough revenue to cover their total costs, including opportunity costs.
Marginal Revenue
Marginal Revenue is the additional income received from selling one more unit of a product.
Q7: (Figure and Table: The Budget Line) Look
Q13: Bessie wants to calculate the accounting and
Q45: (Figure: Revenues, Costs, and Profits for Tomato
Q73: (Figure: Perfectly Competitive Firm) Look at the
Q152: (Table: Demand for Lenny's Coffee) Look at
Q159: In the short run, a perfectly competitive
Q175: To practice effective price discrimination, a monopolist
Q216: For a perfectly competitive firm, marginal revenue:<br>A)
Q217: Most electric, gas, and water companies are
Q220: (Figure: PPV) Look at the figure PPV,