Use the following to answer question: 
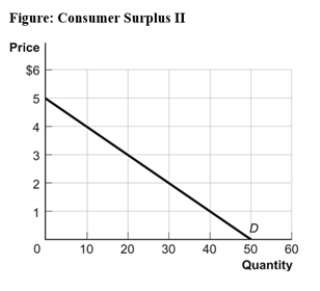
-(Figure: Consumer Surplus II) Look at the figure Consumer Surplus II.If the price of the good increases from $3 to $4,consumer surplus will decrease by:
Definitions:
Supply Curve
A graphical representation showing the relationship between the price of a good or service and the quantity supplied.
Elasticity Coefficients
Numerical measures that indicate how much the quantity demanded or supplied of a good responds to changes in price, income, or other factors.
Total Revenue
The total income generated from the sale of goods or services before any expenses are subtracted.
Demand for Labor
The total amount of labor (number of workers or hours worked) that employers want to hire at various wage rates.
Q3: (Figure: Supply and Demand in Agriculture) Look
Q31: Suppose the U.S. government imposes a binding
Q57: (Table: Consumer Surplus) Look at the table
Q63: A market is composed of three individuals,
Q63: (Figure: The Market for Economics Textbooks) Look
Q98: Suppose there is an excess supply of
Q185: An increase in producer surplus would most
Q193: If the government intervened in the market
Q221: (Table: Consumer Surplus) Look at the table
Q294: (Table: Production Possibilities Schedule II) Look at