Use the following to answer questions :
Figure: Shifts in Demand and Supply II 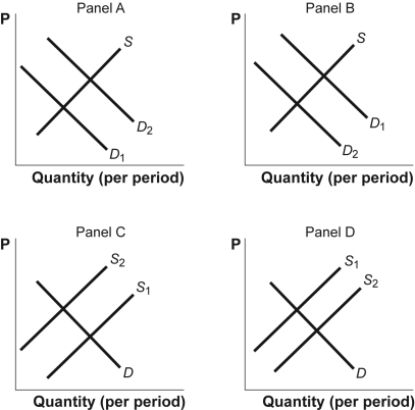
-(Figure: Shifts in Demand and Supply II) Look at the figure Shifts in Demand and Supply II. The graph shows how supply and demand might shift in response to specific events. Suppose a drought destroys one-third of the nation's peanut crop. Which panel BEST describes how this will affect the market for peanuts?
Definitions:
Production Technology
The methods, equipment, and processes used to create goods or services, often involving innovations that improve efficiency.
Number Of Buyers
A factor influencing demand in a market, representing the total count of consumers willing to purchase a product or service.
Supply Curve
A graphical representation showing the relationship between the quantity of goods suppliers are willing to sell and the price of those goods.
Expansion Of Production
The increase in the output of goods and services by a firm or economy, typically involving larger quantities of products or expansion into new markets.
Q17: A binding price floor is a _
Q59: When there is a positive amount of
Q95: (Figure: Consumer Surplus III) In the figure
Q117: In the market for grass-fed beef, what
Q136: You notice that the price of Blu-ray
Q158: Economists may disagree about policies because they:<br>A)
Q185: (Figure: Producer Surplus III) Look at the
Q191: A price ceiling is likely to result
Q227: (Table: The Market for Chocolate-Covered Peanuts) Look
Q292: Suppose residents of Montana operate on their