Use the following to answer questions :
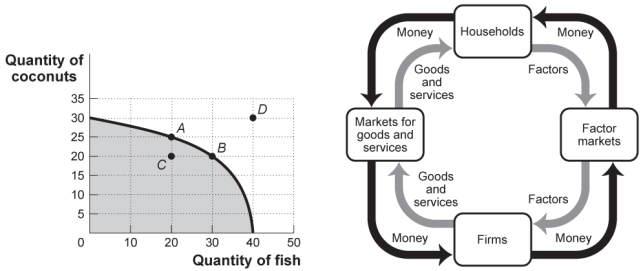
Figure: Production Possibilities and Circular-Flow Diagram 
-(Figure: Production Possibilities and Circular-Flow Diagram) Look at the figure Production Possibilities and Circular-Flow Diagram. Assume the two figures represent the same economy. Suppose that in the circular-flow diagram there is a significant decrease in the amount of labor flowing to the firms that produce coconuts. If all other variables remain unchanged, this adjustment in the economy would be best represented in the production possibilities figure by a move from point A toward:
Definitions:
No Relationship
Outcome of research in which two variables are not related; changes in the first variable are not associated with changes in the second variable.
Negative Linear Relationship
A direct relationship between two variables where an increase in one variable leads to a decrease in another.
Positive Linear Relationship
A relationship between two variables where an increase in one variable is associated with an increase in the other variable, depicted as a straight line.
No Relationship
A situation where two variables do not display any association, correlation, or cause-and-effect interaction with each other.
Q31: The production possibility frontier will shift outward
Q45: If equilibrium exists:<br>A) all individuals must have
Q57: Which of the following statements is TRUE?<br>A)
Q69: Which of the following is not a
Q115: A typical bowed-out production possibility frontier between
Q120: Because of an increase in the price
Q176: In building models, economists often assume that
Q193: The supply curve for apartments in Oregon
Q269: If farmer Sam MacDonald can produce 200
Q276: (Figure: Strawberries and Submarines) Look at the