Refer to the figure. 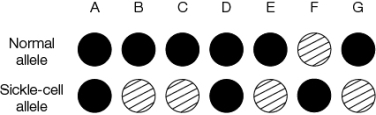 The figure presents the data from individuals who have been tested for sickle-cell anemia using allele-specific oligonucleotide hybridization.The solid circles represent hybridization; the lined circles represent lack of hybridization.Which individuals have sickle-cell anemia?
Definitions:
Bell-Shaped
A bell-shaped curve is a graph of a distribution that resembles the shape of a bell, typically representing a normal distribution in which the bulk of the values lie towards the center and taper off symmetrically towards the extremes.
Standard Deviation
A measure of the dispersion or variability within a set of numerical data, indicating how spread out the values are.
Mean
The arithmetic average of a set of numbers, found by dividing the sum of all the numbers by the count of the numbers.
Population Variance
A measure of the dispersion of a set of data points in a population, calculated as the average of the squared deviations from the mean.
Q10: Mutations that are not due to the
Q76: With a small number of genes, a
Q80: In RNA viruses, single-stranded RNA replicates by<br>A)
Q90: A disease _ is most likely treated
Q110: Refer to the figure showing the initiation
Q111: A researcher studying multi-coloration of Zea mays
Q148: The modified base inosine contributes to<br>A) the
Q173: Refer to the figure. <img src="https://d2lvgg3v3hfg70.cloudfront.net/TB5650/.jpg" alt="Refer
Q212: The region of the gene that binds
Q215: In eukaryotes, RNA polymerase by itself cannot