The graph shows the range of variation among population members for a trait determined by multiple genes. 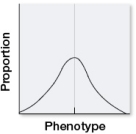 Suppose that there were no genetic component to this trait.If this population were subject to stabilizing selection for several generations, which distributions would be most likely to result? Assume that the environment stayed the same.
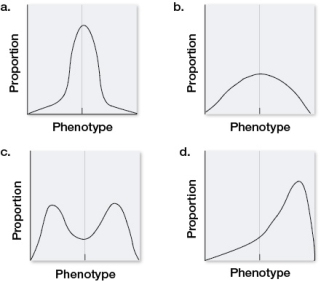
Definitions:
Contractility
The ability of muscle cells and tissues to contract or shorten, generating force.
Tendons
Tough, fibrous tissues that connect muscles to bones, allowing for the transmission of force when muscles contract.
Canaliculi
Small, channel-like structures in bones that allow for communication and nutrient exchange between bone cells.
Haversian Canals
Channels extending through the matrix of bone; contain blood vessels and nerves.
Q13: Which statement about recombinant DNA is true?<br>A)
Q44: Refer to the figure showing the wing
Q65: Members of genus X, a hypothetical taxon
Q114: Soon after the sequence of Haemophilus influenzae
Q142: Suppose individual robins with longer beaks have
Q170: A windstorm transports a gravid fly to
Q183: In the context of metabolomics, glucose, as
Q189: An allele in a population of trout
Q193: A universal adapter used in a sequencing
Q225: Five different phylogenetic trees of a group