The graph shows the range of variation among population members for a trait determined by multiple genes. 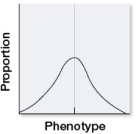 If this population were subject to stabilizing selection for several generations, which, if any, of the distributions shown would be most likely to result?
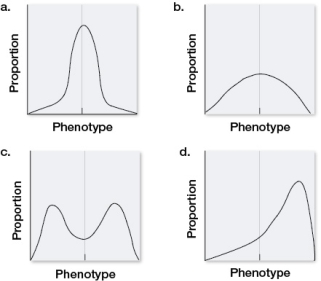
Definitions:
Heterozygous
Having two different alleles of a particular gene, one inherited from each parent.
Sex Chromosomes
Chromosomes involved in determining the sex of an organism, with human males typically having one X and one Y chromosome, and females having two X chromosomes.
X Chromosome
One of the two sex chromosomes, which plays a crucial role in determining genetic sex and can carry genes affecting various traits and conditions.
Y Chromosome
A sex chromosome found in males that is paired with an X chromosome and determines male biological characteristics.
Q19: A plasmid that is to be used
Q27: A population of mice has been monitored
Q38: Which source of molecular data would be
Q54: What was the original source of the
Q61: Suppose a team of biologists discover and
Q71: The table shows the number of offspring
Q157: According to the evidence, the common ancestor
Q164: You are a researcher wanting to study
Q181: Which technology is used to examine the
Q235: Refer to the figure. <img src="https://d2lvgg3v3hfg70.cloudfront.net/TB5650/.jpg" alt="Refer