Refer to the figure, which shows a scatterplot of genome size versus number of protein-coding genes found in different classes of microbes. 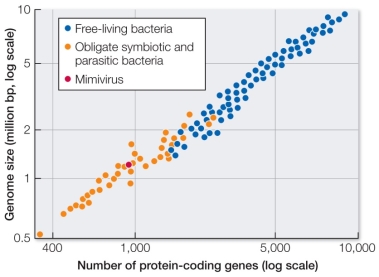 Based on these data, state and justify the most likely origin of the mimivirus, and present an alternative hypothesis for the origin of this and other viruses.
Definitions:
5-number Summary
A descriptive statistic that provides a quick overview of a dataset's distribution through five key numbers: minimum, first quartile, median, third quartile, and maximum.
Interquartile Range
The measure of variability which is the difference between the third quartile and the first quartile in a dataset, indicating the spread of the middle 50%.
Percentiles
Values or scores below which a given percentage of observations in a group of observations fall.
Decile
A statistical measure dividing a dataset into ten equal parts, each containing 10% of the data points.
Q46: Dormant endospores of a species of _
Q63: A gene family that codes for various
Q116: Refer to the figure. <img src="https://d2lvgg3v3hfg70.cloudfront.net/TB5650/.jpg" alt="Refer
Q120: A group of oxygen-generating bacteria, the _,
Q161: Refer to the figure, which shows the
Q174: Refer to the figure, which illustrates Earth
Q174: Which anatomical feature of eukaryotes played the
Q181: The period during which most of Earth's
Q201: The _ technique permits comparison of sequences
Q210: The world's oldest recorded living tree is