Refer to the table. 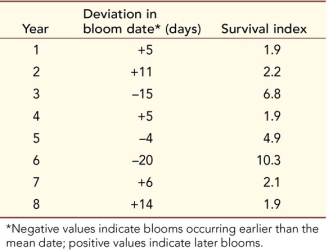 In most temperate regions of the oceans, there is a spring bloom of phytoplankton.Although the red tide blooms are harmful, phytoplankton blooms can also be beneficial for marine communities.In fact, many species of marine life depend on these blooms for their survival.The dates of spring phytoplankton blooms near the coast of Nova Scotia, Canada, were determined by examining remote satellite images.The table shows these dates as deviations from the mean date of the spring bloom in this region; it also gives the survival index for larval haddock (an important commercial fish) for the year after each bloom.The survival index is the ratio of the mass of juvenile fish to the mass of mature fish; higher values indicate better survival of larval fish.
Plot the survival index of larval haddock against the deviation in the date of the spring phytoplankton bloom.Calculate a correlation coefficient for their relationship (see Appendix B in the textbook).
Definitions:
Standard Deviation
An indicator of the degree of spread or variability among a collection of figures.
One-sample T Statistic
A statistic used to compare the mean of a single sample to a known or hypothesized population mean.
P-value
The chance of getting test findings that are at least as unusual as the ones actually seen, given that the null hypothesis holds.
Null Hypothesis
A default hypothesis that there is no effect or difference, and any observed change in the data is due to random chance.
Q4: In the fern life cycle,<br>A) the mature
Q40: Outline the logical steps necessary for the
Q43: You work with the Centers for Disease
Q44: Which statement about nitrogen metabolism is false?<br>A)
Q70: Which of the following statements is false?<br>A)
Q196: _ is a process in which certain
Q206: Amoebas use _ for locomotion.
Q212: The angiosperm carpel serves to<br>A) protect the
Q235: Which trait shared by coleochaetophytes, stoneworts, and
Q245: _ have cell walls typically composed of