Refer to the graph showing how different types of organisms respond to changes in environmental temperature. 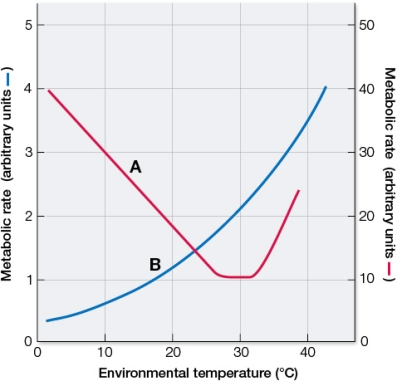 The curve labeled _______ is appropriate for a lizard, and the curve labeled _______ is appropriate for a mouse.As the environmental temperature these animals are subjected to rises from 10°C to 20°C, the metabolic rate of the lizard _______ and the metabolic rate of the mouse _______.
Definitions:
Q11: Hormones released by the posterior pituitary are
Q57: Which situation would not be suitable for
Q112: You monitor a lizard's body temperature in
Q124: Acclimation is most likely to result from
Q129: Avr genes are<br>A) antivirulence genes.<br>B) antiviral genes.<br>C)
Q159: Halophytes take up sodium and chloride ions
Q163: Which correctly represents an energy budget?<br>A) Metabolism
Q169: If you are out in subfreezing weather
Q190: In the disease diabetes mellitus, a lack
Q219: A body's tolerance to its own molecules