Refer to the graph showing how different types of organisms respond to changes in environmental temperature. 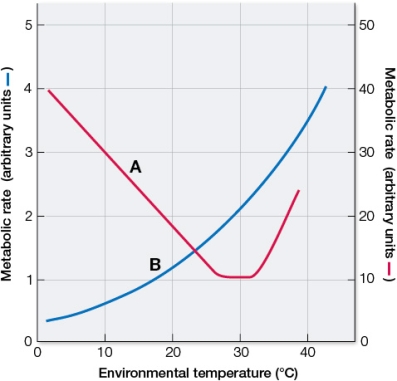 One of these curves represents a lizard, and the other represents a mouse.Which curve corresponds to which animal? At what environmental temperatures are the metabolic rates of the lizard the highest and the lowest? At what environmental temperatures are the metabolic rates of the mouse the highest and the lowest?
Definitions:
Q13: If an animal is kept in an
Q20: Dietary caffeine increases the loss of calcium
Q63: Prior to the introduction of iodized table
Q76: Masking experiments demonstrated that _ measure the
Q136: The elephant is better adapted to the
Q161: How many concentric sets of floral organs
Q207: Which genes control formation of floral meristems
Q211: If anterior pituitary cells are grown in
Q218: A mutant plant that does not produce
Q246: Refer to the graph showing body temperature