Refer to the graph below, showing population cycles of snowshoe hares and their predator, Canada lynx.Population numbers were collected when both populations were trapped for the fur trade. 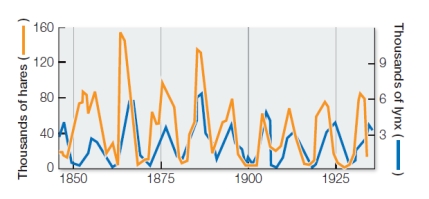 In the study of snowshoe hares and Canada lynx, this predator-prey interaction showed tightly controlled population cycles of approximately 10 years.The hares' numbers peaked, followed by peaks in lynx numbers approximately 2 to 3 years later.Assuming a cause-and-effect relationship between the two species, if lynx were removed from the community, the hare population would likely
Definitions:
Q7: Corals affect their communities by producing elaborate
Q70: The oxygen produced by photosynthesis is considered
Q100: A scientist analyzes genetic differences in all
Q102: The actions of a frugivore become part
Q167: The world's biogeographic regions, originally proposed by
Q167: In the Trinidad guppy populations studied by
Q207: Which situation is an example of an
Q225: Compared with the open ocean ecosystem, the
Q237: In which situation is the growth rate
Q242: Humans and other large animals, as well