Refer to the graph. 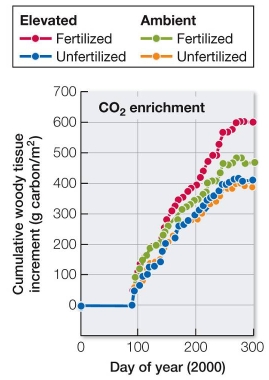 In the FACE experiment in a North Carolina forest, the amount of tree growth (change in carbon biomass per square meter) was measured under conditions of ambient CO2 (270 ppm in 2000, when measurements were done) and elevated CO2 (550 ppm) .Half of both the ambient and elevated plots were given additional nitrogen (fertilized) ; the other half were not (unfertilized) .According to the results shown, what can be concluded about the effectiveness of elevated CO2 on increasing rate of tree growth?
Definitions:
Q35: All of the following may be used
Q35: Explain the concept of "filters" in determining
Q37: Which biogeochemical cycle does not have a
Q64: Based on our current understanding of polycultures,
Q96: Which of these animals would likely have
Q119: Two fish species live and compete on
Q122: Each country that participates in CITES issues
Q123: When it was established, the U.S.Forest Service
Q195: Eastern tent caterpillars are social nesters that
Q218: After a volcanic eruption, weathering, rain, and