Figure 6-5 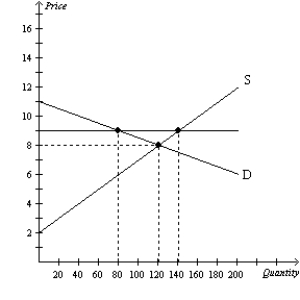
-Refer to Figure 6-5.If the solid horizontal line on the graph represents a price ceiling,then the price ceiling is
Definitions:
Unit Variable Cost
The cost associated with producing one additional unit of a product, which typically includes materials and labor.
Fixed Costs
Expenses that do not change with the level of production or sales activity, such as rent, salaries, and insurance premiums.
Contribution Margin
The amount by which sales revenue exceeds variable costs of goods sold, indicating how much revenue contributes towards covering fixed costs and generating profit.
Variable Costs
Expenses that change in proportion to the level of production or sales activity, such as raw materials and direct labor.
Q5: Refer to Figure 7-12.If the equilibrium price
Q5: Other things equal,the demand for a good
Q16: Which of the following will cause a
Q24: Refer to Figure 6-8.If the government imposes
Q28: Refer to Figure 7-1.If the price of
Q36: A good will have a more elastic
Q114: Refer to Figure 6-23.How much tax revenue
Q208: Which of the following statements about the
Q248: Using the midpoint method,the price elasticity of
Q262: Refer to Figure 5-3.Which demand curve is