Examlex

Solved

Figure 35-9

question 46

Multiple Choice

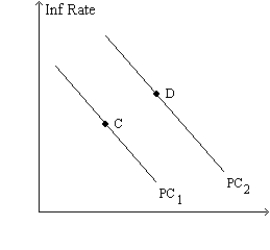
Figure 35-9.The left-hand graph shows a short-run aggregate-supply (SRAS) curve and two aggregate-demand (AD) curves.On the right-hand diagram,"Inf Rate" means "Inflation Rate." Figure 35-9.The left-hand graph shows a short-run aggregate-supply (SRAS) curve and two aggregate-demand (AD) curves.On the right-hand diagram, Inf Rate  means  Inflation Rate.      -Refer to Figure 35-9.Subsequent to the shift of the Phillips curve from PC<sub>1</sub> to PC<sub>2</sub>,the curve will soon shift back to PC<sub>1</sub> if people perceive the A) increase in the inflation rate as a temporary aberration. B) economic boom as a temporary aberration. C) increase in the inflation rate as a sign of a new era of higher inflation. D) economic boom as a sign of a new era of higher economic growth. Figure 35-9.The left-hand graph shows a short-run aggregate-supply (SRAS) curve and two aggregate-demand (AD) curves.On the right-hand diagram, Inf Rate  means  Inflation Rate.      -Refer to Figure 35-9.Subsequent to the shift of the Phillips curve from PC<sub>1</sub> to PC<sub>2</sub>,the curve will soon shift back to PC<sub>1</sub> if people perceive the A) increase in the inflation rate as a temporary aberration. B) economic boom as a temporary aberration. C) increase in the inflation rate as a sign of a new era of higher inflation. D) economic boom as a sign of a new era of higher economic growth.
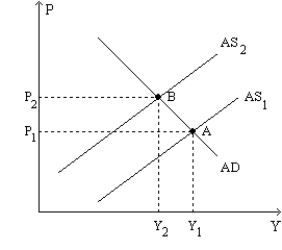
-Refer to Figure 35-9.Subsequent to the shift of the Phillips curve from PC1 to PC2,the curve will soon shift back to PC1 if people perceive the


Definitions:

Related Questions