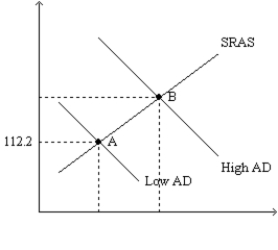
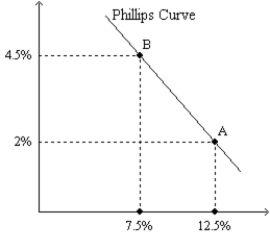
Figure 35-4.The left-hand graph shows a short-run aggregate-supply (SRAS) curve and two aggregate-demand (AD) curves.On the left-hand diagram,the price level is measured on the vertical axis;on the right-hand diagram,the inflation rate is measured on the vertical axis. 

-Refer to Figure 35-4.What is measured along the horizontal axis of the right-hand graph?
Definitions:
Effective-interest
A method of calculating the interest rate on a loan or financial product that takes into account compound interest and fees, providing a true annual rate.
Amortization
The method of distributing the expense of a non-physical asset across its lifespan.
Market Rate
The prevailing rate of interest available in the marketplace for securities or loans.
Bond Issue
The process of offering bonds for sale to investors by an issuer as a method of raising capital.
Q10: An economic expansion caused by a shift
Q14: The economy is in long-run equilibrium when
Q14: Which of the following things can a
Q22: Refer to figure 35-8.Suppose the economy starts
Q23: Suppose the central bank decreases the growth
Q39: Which of the following would tend to
Q41: A program to reduce inflation is likely
Q42: When the Fed increases the money supply,we
Q104: In 2009 President Obama and Congress increased
Q109: In which case can we be sure