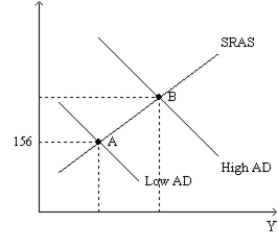
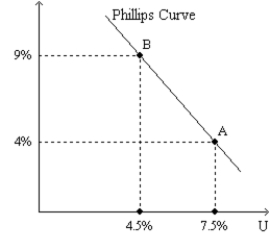
Figure 35-3.The left-hand graph shows a short-run aggregate-supply (SRAS) curve and two aggregate-demand (AD) curves.On the left-hand diagram,Y represents output and on the right-hand diagram,U represents the unemployment rate. 

-Refer to Figure 35-3.What is measured along the vertical axis of the left-hand graph?
Definitions:
Work
An activity involving mental or physical effort done to achieve a purpose or result, often associated with earning a livelihood in the context of employment.
Mode of Subsistence
The method by which a society acquires its food and economic resources, which can range from hunting and gathering to agriculture or industrial production.
Hunting
The pursuit and capturing or killing of wildlife or feral animals, primarily done for food, sport, or trade.
Fishing
The activity of catching fish either for recreational purposes or as a means of livelihood, practiced in various bodies of water.
Q18: Refer to Scenario 34-1.The multiplier for this
Q24: An decrease in taxes shifts aggregate demand<br>A)to
Q28: The principal reason that monetary policy has
Q28: Refer to the Economy in 2008.The effects
Q39: When aggregate demand is high,risking higher inflation,those
Q45: In which case can we be sure
Q70: While a television news reporter might state
Q86: Refer to Figure 34-4.Which of the following
Q131: If the government reduced the minimum wage
Q198: The idea that a decrease in the