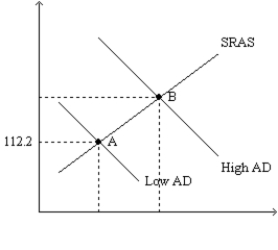
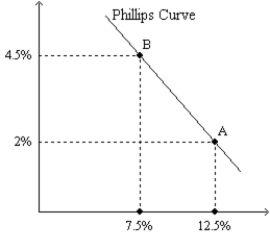
Figure 35-4.The left-hand graph shows a short-run aggregate-supply (SRAS) curve and two aggregate-demand (AD) curves.On the left-hand diagram,the price level is measured on the vertical axis;on the right-hand diagram,the inflation rate is measured on the vertical axis. 

-Refer to Figure 35-4.What is measured along the horizontal axis of the right-hand graph?
Definitions:
Privatization
The process of transferring ownership of a business, enterprise, agency, public service, or public property from the government to private individuals or organizations.
Export Promotion
Strategies and policies aimed at encouraging the export of goods and services in order to improve a country’s trade balance and foster economic growth.
Infant Industries
New or emerging sectors or businesses that may not yet be competitive on a global scale and are often protected or supported by government policies until they can compete internationally.
Protected Market
A market shielded from foreign competition by tariffs, quotas, or other trade barriers to protect domestic industries.
Q10: Refer to Figure 34-5.A shift of the
Q17: The multiplier effect states that there are
Q34: Which of the following likely occurs when
Q42: An increase in the price of oil
Q55: Suppose the MPC is 0.60.Assume there are
Q82: If a central bank reduced inflation by
Q87: The consequences of the Volcker disinflation demonstrated
Q90: If the Federal Reserve decreases the rate
Q115: If output is above its natural rate,then
Q167: According to the liquidity preference theory,an increase