Figure 27-1.The figure shows a utility function. 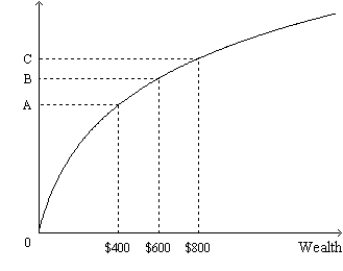
-Refer to Figure 27-1.Let 0A represent the distance between the origin and point A;let AB represent the distance between point A and point B;etc.Which of the following ratios best represents the marginal utility per dollar when wealth increases from $400 to $600?
Definitions:
Income
The money received by an individual or organization, typically measured on a regular basis, for work or through investments.
MRS of Pencils
The marginal rate of substitution of pencils, indicating how much of another good a consumer is willing to give up for one more pencil.
Utility
In economics, a measure of satisfaction or happiness that a consumer derives from consuming goods and services.
Consumption Bundle
A collection of goods and services that an individual or household purchases over a given period.
Q37: When a union raises the wage above
Q60: Mary Beth is risk averse and has
Q101: Suppose the interest rate is 8 percent.Consider
Q112: John is a stockbroker.He has had several
Q117: Suppose the parents of a child born
Q140: The unemployment rate is computed as the
Q153: At which interest rate is the present
Q159: If Canada goes from a large budget
Q173: Three years ago Dawn put $1,200 into
Q207: A bond promises to pay $500 in