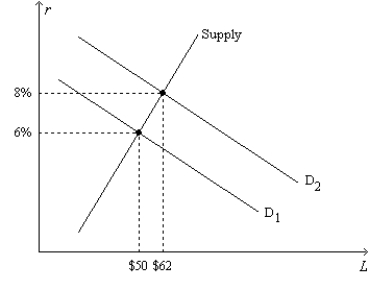
Figure 26-4.On the horizontal axis of the graph,L represents the quantity of loanable funds in billions of dollars. 
-Refer to Figure 26-4.Regard the position of the Supply curve as fixed,as on the graph.If the real interest rate is 4 percent,the inflation rate is 2 percent,and the market for loanable funds is in equilibrium,then the position of the demand-for-loanable-funds curve must be
Definitions:
Perceptual Maps
A visual tool used in marketing to display the perceptions of customers or potential customers regarding products, brands, or companies on various dimensions.
Cannibalization Effects
The reduction in sales volume, revenue, or market share of one product as a result of the introduction of a new product by the same company.
Strategic Marketing Process
A systematic approach to planning, executing, and managing marketing strategies to achieve business objectives.
Implementation Phase
The stage in a project or plan where strategies are executed and the theoretical models are turned into practical actions.
Q12: A manufacturing company is thinking about building
Q24: Morgan,a financial advisor,has told her clients the
Q53: Suppose a closed economy had public saving
Q62: An increase in the number of corporations
Q63: According to the rule of 70,if a
Q80: Which of the following statements is correct?<br>A)NASDAQ
Q85: Refer to Scenario 26-2.For this economy,private saving
Q121: If the best educated and most skilled
Q128: Jerry has the choice of two bonds,one
Q139: A change in the tax laws that