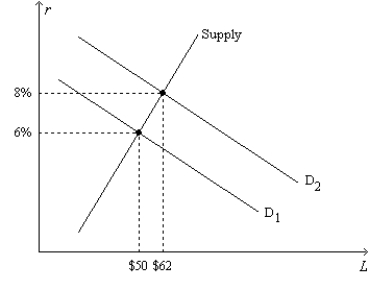
Figure 26-4.On the horizontal axis of the graph,L represents the quantity of loanable funds in billions of dollars. 
-Refer to Figure 26-4.If the equilibrium quantity of loanable funds is $56 billion and if the rate of inflation is 4 percent,then the equilibrium real interest rate is
Definitions:
Price Doubles
A situation where the price of a good, service, or commodity increases to twice its previous level, affecting supply and demand dynamics.
Intensive Margin
The degree to which factors of production, such as labor, are utilized more intensely to increase output in the short term.
Consumption Changes
Variations in the amount and types of goods and services used by households over time.
Barley Crop
A cereal grain that is used worldwide as fodder for animals, as a source of fermentable material for beer and certain distilled beverages, and as a component of various health foods.
Q2: In which of the following instances is
Q18: An asset market is said to experience
Q48: A company that produces baseball gloves is
Q80: Which of the following statements is correct?<br>A)NASDAQ
Q88: In the small closed economy of San
Q144: The president of Suldinia,a developing country,proposes that
Q160: Mixster Concrete Company is considering buying a
Q160: A corporation's earnings are<br>A)the amount of revenue
Q185: What would happen in the market for
Q197: Refer to Figure 26-4.Which of the following