Multiple Choice
A random sample of statistics students was selected. The heights (inches) and the weights (pounds) of the students were collected and are displayed in the figure below. 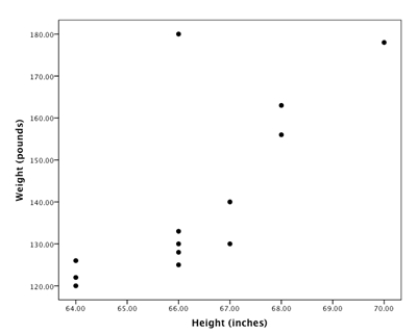 What is the approximate correlation between these two variables?
Definitions:
Related Questions
Q3: A(n) _ is the entire collection of
Q6: A local planning commission is interested in
Q15: When we take a census, we<br>A) run
Q16: Three of the following questions lend themselves
Q23: The scout troop is selling brownies for
Q23: In order to gauge student opinion on
Q29: Referring to Instruction 18-11,based on the chart
Q32: A Gallup Poll contacts people by dialing
Q34: Lean body mass (your weight leaving out
Q96: Referring to Instruction 18-10,suppose the supervisor constructs