Instruction 12-11
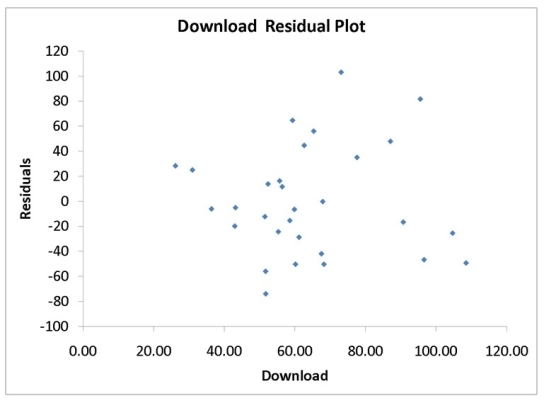
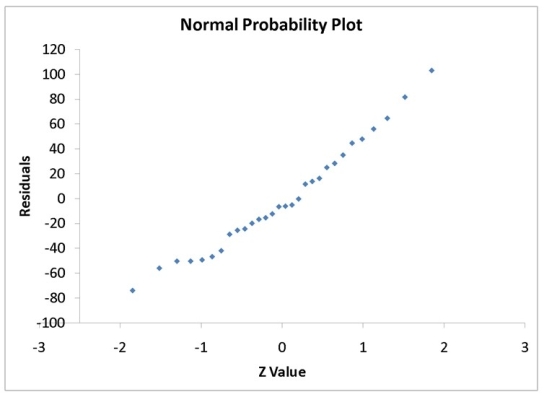
A computer software developer would like to use the number of downloads (in thousands)for the trial version of his new shareware to predict the amount of revenue (in thousands of dollars)he can make on the full version of the new shareware.Following is the output from a simple linear regression along with the residual plot and normal probability plot obtained from a data set of 30 different sharewares that he has developed:
ANOVA
-Referring to Instruction 12-11,the null hypothesis for testing whether there is a linear relationship between revenue and number of dowloads is "There is no linear relationship between revenue and number of downloads".
Definitions:
Mid-Level
Pertains to a position, status, or area that is in between the highest and the lowest levels, often implying a moderate degree of complexity or authority.
Grand
Large, magnificent, or impressive in size, appearance, or style.
Parsimonious
Describing an explanation or theory that is simple and lacks unnecessary elements, often preferred for its efficiency and effectiveness in problem-solving.
Mini Theories
Specific, narrow theories that address particular aspects of behavior rather than broad, overarching models.
Q16: Suppose,in testing a hypothesis about a proportion,the
Q27: Referring to Instruction 11-5,interpret the test for
Q62: Referring to Instruction 11-2,at a significance level
Q77: A Type I error is committed when<br>A)we
Q93: Referring to Instruction 10-9,the company tests to
Q107: Referring to Instruction 11-6,what is the value
Q128: Referring to Instruction 10-8,if you want to
Q137: Referring to Instruction 9-7,the value of β
Q151: Referring to Instruction 13-16 Model 1,which of
Q153: Referring to Instruction 13-16 Model 1,what are