Instruction 12-11
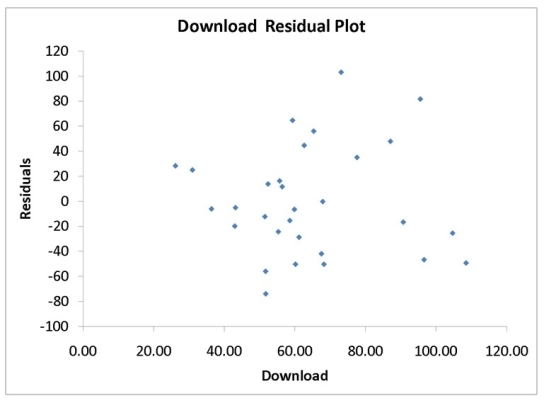
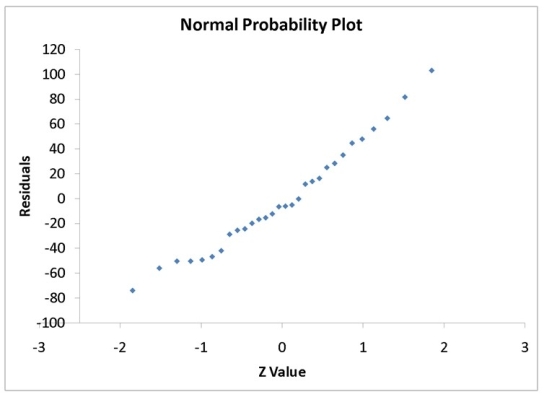
A computer software developer would like to use the number of downloads (in thousands)for the trial version of his new shareware to predict the amount of revenue (in thousands of dollars)he can make on the full version of the new shareware.Following is the output from a simple linear regression along with the residual plot and normal probability plot obtained from a data set of 30 different sharewares that he has developed:
ANOVA
-Referring to Instruction 12-11,the null hypothesis for testing whether there is a linear relationship between revenue and number of dowloads is "There is no linear relationship between revenue and number of downloads".
Definitions:
Early Majority
A group in the diffusion of innovation model, representing consumers who adopt new products or technologies just before the average person and after the innovators and early adopters.
Microfibre Shirts
Clothing made from microfiber, a fine synthetic fiber known for its softness, durability, and moisture-wicking properties.
Advergaming
is a marketing strategy where video games are used to promote a brand, product, or message.
Advertising Pop-Ups
Advertising pop-ups are digital advertisements that appear over or on top of website content, often interrupting the user's viewing experience to capture attention.
Q34: In a one-factor ANOVA analysis,the among sum
Q68: Referring to Instruction 13-14,the value of the
Q72: Referring to Instruction 10-4,suppose ? = 0.01.Which
Q80: The Sydney Morning Herald recently published an
Q89: Referring to Instruction 13-13,you can conclude that
Q123: Referring to Instruction 13-16 Model 1,which of
Q137: Referring to Instruction 14-19,plot both the number
Q140: Referring to Instruction 11-7,what should be the
Q184: Referring to Instruction 13-16 Model 1,which of
Q233: Referring to Instruction 13-13,there is sufficient evidence