Instruction 12-11
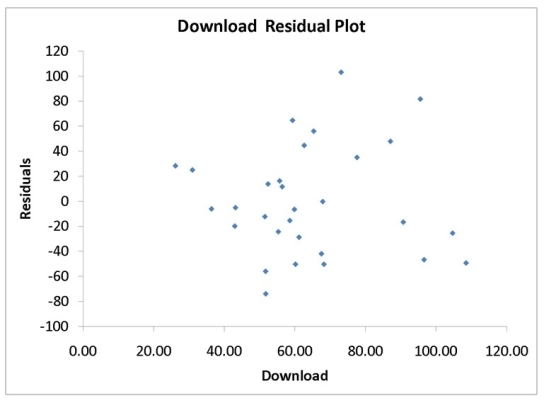
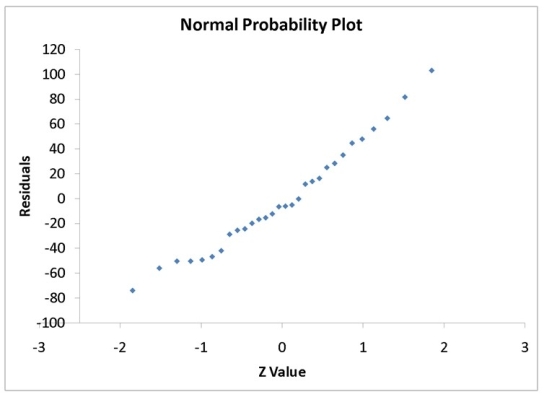
A computer software developer would like to use the number of downloads (in thousands)for the trial version of his new shareware to predict the amount of revenue (in thousands of dollars)he can make on the full version of the new shareware.Following is the output from a simple linear regression along with the residual plot and normal probability plot obtained from a data set of 30 different sharewares that he has developed:
ANOVA
-Referring to Instruction 12-11,what are the lower and upper limits of the 95% confidence interval estimate for the mean change in revenue as a result of a 1 thousand increase in the number of downloads?
Definitions:
Portfolio
A collection of investments held by an individual or institution, which may include stocks, bonds, real estate, and other financial assets.
Indifference Curves
Graphical representations in economics showing different bundles of goods between which a consumer is indifferent, reflecting preferences of equal utility.
Budget Line
A graphical representation of all possible combinations of two goods that an individual can afford to purchase with a given budget, at given prices.
Risk Averse
Describes individuals or entities that prefer to avoid risk, often opting for safer investments even with potentially lower returns.
Q5: To convert actual dollars to real dollars,multiple
Q30: Referring to Instruction 12-12,there is sufficient evidence
Q30: Referring to Instruction 9-2,what is the power
Q46: If you wanted to find out if
Q89: Referring to Instruction 11-9,the null hypothesis will
Q91: The confidence interval for the mean of
Q114: When an additional explanatory variable is introduced
Q132: Referring to Instruction 12-10,what is the p-value
Q136: You have created a 95% confidence interval
Q138: Referring to Instruction 11-10,the value of the